SQL Server Failover Clustered Instances (FCI) and Availability Groups (AG) depend a lot on Windows Server Failover Clustering (WSFC). Understanding how the underlying WSFC platform works can help us maintain availability of our databases
In the first blog post in this series, I talked about how to use the Cluster Dependency Report to identify the potential cause of a SQL Server FCI or AG being offline. In the second blog post, I talked about how to use the SQL Server error log to find the two most common keywords that can cause availability issues.
I’ve gotten some feedback from several SQL Server experts who have read my blog posts. A common theme about the feedback was “It’s not that simple.”
From my experience working with customers on SQL Server FCI and AG deployments, the biggest challenge I see when addressing availability issues is “the human aspect” (well, actually, its true for just about any issue you can think of). Either the support team does not know what to do or are confused with which one to focus on first. Hence, the reason behind simplifying the process of identifying problems that are causing availability issues with the overall goal of bringing the SQL Server FCI or AG back online as quickly as we possibly can.
Navigating The Windows Event Log
After looking at the Cluster Dependency Report, you can quickly identify the possible component that caused your SQL Server FCI or AG to go offline. If it’s the SQL Server resource, you can head over to the SQL Server error log to identify what caused the issue from the database engine point-of-view. But if it isn’t, this is where the Windows Event Log can help.
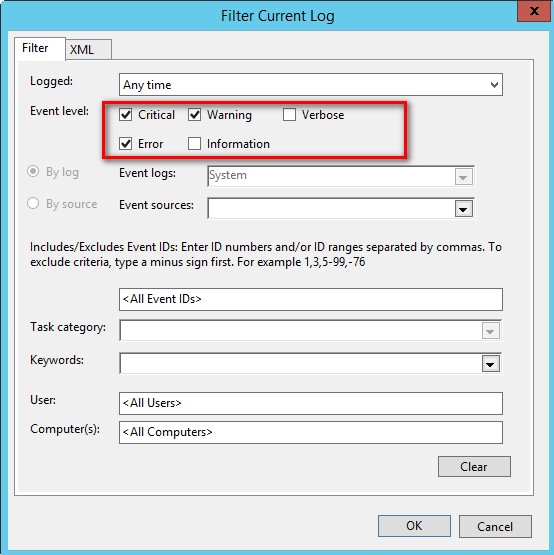
The Windows Event Log can be very overwhelming especially when you have other stuff running on your WSFC such as monitoring agents, firmware, utilities, etc. To simplify the troubleshooting process, I start with the System event log, filter out any other messages and only display those that are marked Critical, Waring and Error.

This makes it easy for me to only focus on what events were reported with these levels that may have caused availability issues to my SQL Server FCI and AG.
As always, I try to minimize the use of the GUI especially for repetitive tasks. So, I use the PowerShell cmdlet Get-EventLog to do the trick.
Get-EventLog -LogName System -EntryType Error,Warning
The beauty of this is that I can pass a list of server names as a parameter in the Get-EventLog PowerShell cmdlet using the -ComputerName parameter. Which means I can display all of the Error and Warning events for all of the member servers in my WSFC – in a single line of PowerShell code.
Get-EventLog -LogName System -ComputerName WSFC-NODE1, WSFC-NODE2, WSFC-NODE3 -EntryType Error,Warning
Even better, I can display only those events that occurred within a specific time frame. That way, I can really zoom in on those specific events when the issue occurred (or when the customer decided to report it).
$Oct31 = Get-Date 10/31/2016
$Nov13 = Get-Date 11/13/2016
Get-EventLog -LogName System -ComputerName WSFC-NODE1, WSFC-NODE2, WSFC-NODE3 -EntryType Error,Warning -After $Oct31 -before $Nov13
You might be wondering why the Critical events are not included in the -EntryType parameter. That’s because the Get-EventLog PowerShell cmdlet is old school – it’s been around ever since the Monad days. A recommended approach is to use the Get-WinEvent PowerShell cmdlet. The only reason I use Get-EventLog is because its easier to use and I know that I don’t have to worry about what version of PowerShell is running on the servers. For more complex PowerShell scripts, I use the Get-WinEvent PowerShell cmdlet.
Failover Clustering Event Logs
I’ve avoided talking about the failover cluster error logs up to this point. That’s because I don’t want support engineers and server administrators to look at the this as their first option. I want it to be the last option, especially the cluster debug logs. I’ve seen engineers waste a lot of time trying to fix an availability issue with a SQL Server FCI or AG only to find out that the real issue is outside of the failover cluster. One very common example is when the virtual network name could not come online. It could be because there is a duplicate IP address on the network or that the virtual computer object was accidentally deleted in Active Directory. Had the troubleshooting process started with the Cluster Dependency Report, it could have been communicated a lot sooner to the Active Directory or the DNS administrators to get them involved in solving the issue.
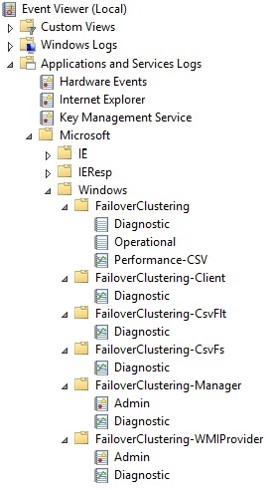
Now, on to the Failover Clustering Event Logs. Open the Windows Event Logs via Event Viewer and navigate to Applications and Services Log -> Microsoft -> Windows -> FailoverClustering to start with. Have a look at the different event categories that you can review to identify the cause of availability issue.

Just by looking at the screenshot, you know that this in itself is still confusing. Now, you know why I didn’t start with this option first 🙂
I usually ignore events that are irrelevant. For example, I ignore anything under the FailoverClustering-CsvFs and FailoverClustering-CsvFlt if I don’t have cluster shared volumes (CSVs) configured in the WSFC. But I go directly to the FailoverClustering -> Diagnostic and Operational events to start digging deeper.
Digging Deeper
At this point in the troubleshooting process, you’ve gone from quickly identifying why your SQL Server FCI or AG is unavailable to finding out the root cause. Stop right there.
Didn’t we say that the goal was to bring the SQL Server FCI or AG online as quickly as we possibly can? It’s not that I’m discouraging you from finding the root cause of the problem. It’s just that we need to be focused on the main goal. If you’ve identified why your SQL Server FCI or AG is offline, make every effort to bring it back online as soon as you possibly can. Leave the “digging deeper” part after everything is back to normal.
In the next blog post, I’ll talk about how to read the cluster debug log and how to identify the real root cause of the availability issue. And while I like getting really geeky about reading the cluster debug log or even crash dumps, I don’t want you to do that first when trying to resolve an availability issue unless you really have no choice.
Schedule a Call


